 |
| PFDA Weekly Briefer for Weekly Fish Unloading from April 5 to 11, 2021 |
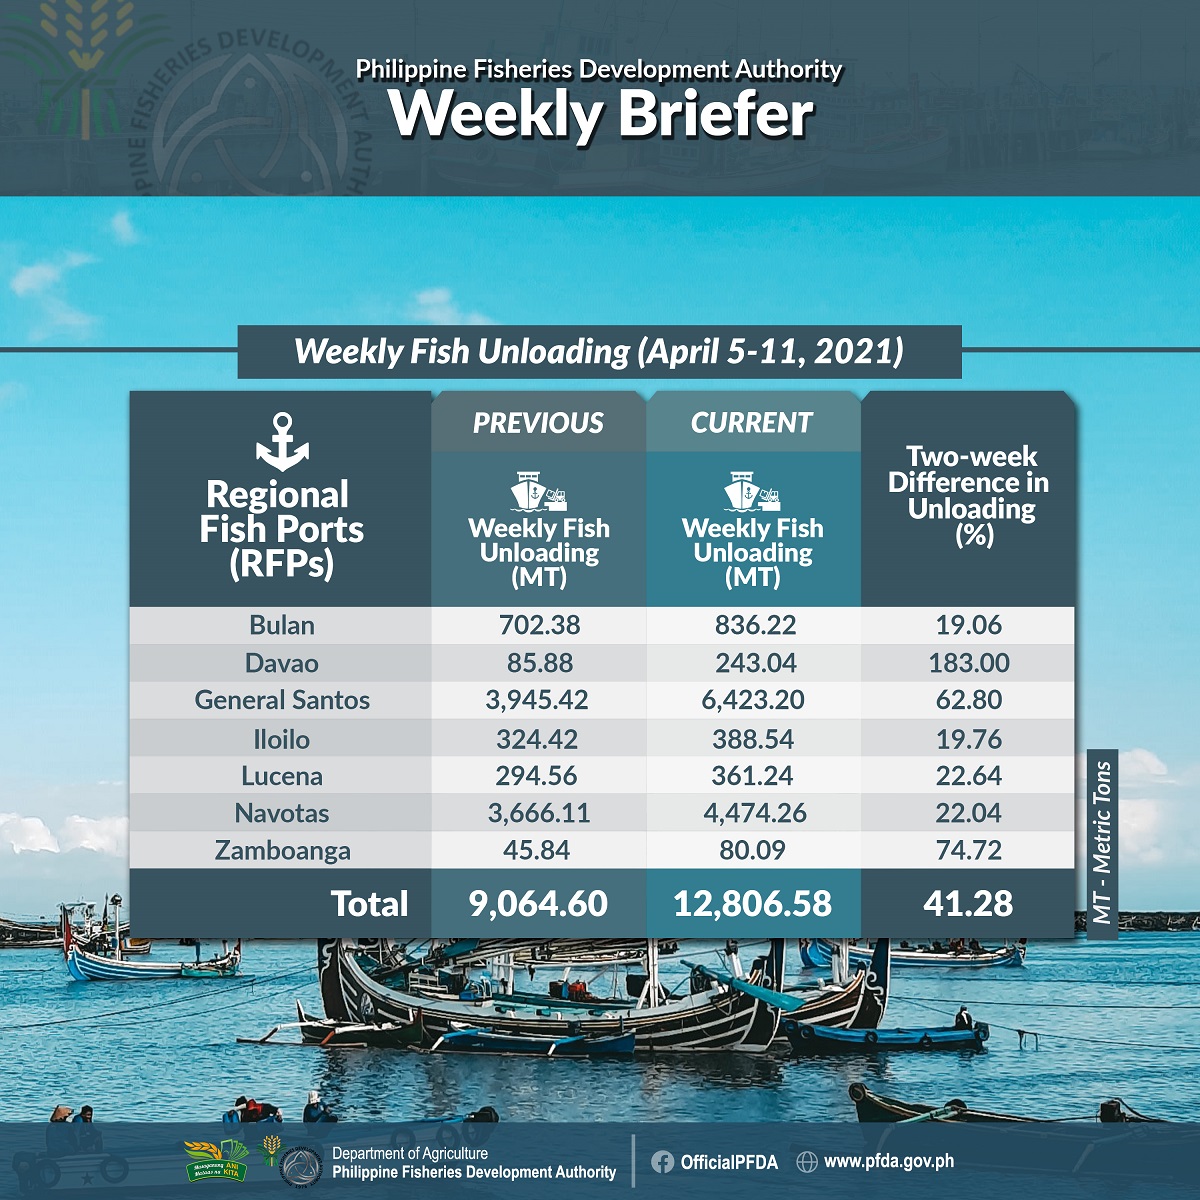
Following several weeks of decline in the unloaded volume of fish, Philippine Fisheries Development Authority (PFDA) Regional Fish Ports (RFPs) is back on track in delivering quality and adequate fish to their clients and stakeholders after registering 12,806.58 metric tons (MT) of unloaded fish supply during the April 5 to 11, 2021 period.
Based on a two-week comparative report from the Operations Services Division (OSD), this significant fish supply is equivalent to a 41.28 percent increase from last week’s catch. By far, this is the second-highest unloading of fish recorded by RFPs since the start of the year, next to 13,528.63 MT unloading volume last March 15-21.
PFDA – General Santos Fish Port Complex (PFDA-GSFPC) led the increase of unloading volume with 6,423.20 MT (62.80 %) of fish supply.
On the other hand, PFDA – Navotas Fish Port Complex (PFDA-NFPC) also contributed a large volume in this week’s record after unloading 4,474.26 MT (22.04%) of fish.
According to the report, not only PFDA-NFPC and PFDA-GSFPC have recorded significant increase in their fish unloading, but almost every port has played a huge role in the improvement of this week’s numbers.
Bulan Fish Port Complex (PFDA-BFPC) posted a 19.06% growth or equivalent to 836.22 MT of fish.
Subsequently, Iloilo Fish Port Complex (PFDA-IFPC) has recovered from last week’s negative unloading and caught 388.54 MT (19.76%) of fish supply.
Meanwhile, Lucena Fish Port Complex (PFDA-LFPC) steered clear from last week’s negative percentage and has recorded 361.24 MT of fish supply (22.64%).
Moreover, Davao Fish Port Complex (PFDA-DFPC) had the highest increase in percentage compared to all RFPs. Compared to last week’s -70.59% unloading volume, PFDA-DFPC has registered 243.04 MT (183%) of fish supply.
To date, PFDA RFPs have already unloaded a total of 599,282.56 MT of fish since the start of the community quarantine last March 2020.
(Report by Mark Angelo N. Perez and infographic by Paul Vincent Del Rosario - Public Information Division)